Population, income, housing, race, ethnicity, religion, and community demographics · October 2026
New Braunfels is a rapidly growing Central Texas city with a diverse household economy. Established residential neighborhoods, expanding middle-income suburbs, higher-income Hill Country communities, and a substantial retail, tourism, and service economy contribute to its economic landscape.
Household finances vary considerably across the area. Citywide averages offer a starting point, but the differences between individual neighborhoods and surrounding ZIP codes are substantial.
1. The city at a glance
| Indicator | Value | Reference period |
|---|---|---|
| Population | 122,492 | 2025 estimate |
| Population growth since 2020 | +35.5% | 2020–2025 |
| Median household income | $86,021 | 2020–2024 ACS |
| Households | 40,991 | 2020–2024 ACS |
| Owner-occupied share of occupied housing units | 65.3% | 2020–2024 ACS |
New Braunfels had 57,740 residents in 2010 and 90,403 in 2020. Its population has more than doubled since 2010.
The city consequently includes both long-established households and newer residents. Population growth, however, does not automatically translate into equivalent gains in purchasing power across every household.
2. Household income distribution
The city's median household income of $86,021 represents the midpoint of the distribution, rather than the income of a typical household in every neighborhood.
According to the 2020–2024 American Community Survey (ACS) household income distribution:
- 43.5% of households earn $100,000 or more annually.
- 24.7% of households earn less than $50,000 annually.
- Approximately one-third earn between $50,000 and $100,000 annually.
The distribution spans lower-, middle-, and higher-income households. Using comparable 2020–2024 ACS estimates, New Braunfels' median household income of $86,021 exceeds the Texas median of $78,476 and the U.S. median of $80,734.
These figures measure gross household income, which can combine earnings from multiple adults, investments, and other sources. They do not represent individual salaries or disposable income after expenses.
3. Geographic differences in income and housing
Two major ZIP codes illustrate the area's economic contrasts: 78130, covering much of central, eastern, and southern New Braunfels, and 78132, extending into the western and northwestern Hill Country area.
Income and housing by ZIP code
| Indicator | 78130 | 78132 |
|---|---|---|
| Median household income | $83,064 | $135,315 |
| Median owner-occupied home value | $323,200 | $620,300 |
| Homeownership rate | 65.9% | 87.5% |
| Median age | 36.3 | 43.6 |
Median household income in ZIP code 78132 is approximately 63% higher than in 78130. The western and northwestern area also has substantially higher median home values and a larger proportion of owner-occupied housing.
ZIP code 78130: Central, eastern, and southern New Braunfels
This area contains a broad mix of historic neighborhoods, apartments, established homes, commercial corridors, and newer subdivisions. Household incomes and housing values can vary considerably within the same ZIP code.
ZIP code 78132: Western and northwestern Hill Country
This area has higher median incomes, higher home values, and substantially greater homeownership. Its profile is consistent with more large-lot residential properties, established homeowners, and higher-income households.
Historic downtown, Landa Park, and Gruene
These areas do not belong to a single income bracket. Historic properties, smaller older homes, higher-value residences, tourism-oriented properties, and newer developments can exist close together. Reliable neighborhood-level income comparisons would require smaller Census-tract or block-group estimates.
Geographic limitation: ZIP codes do not align with municipal boundaries. ZIP code 78132 alone spans approximately 179 square miles, much of it outside New Braunfels proper. ZIP-code statistics are useful for describing the wider area but cannot determine the income of a particular neighborhood or subdivision.
The inner West End and older neighborhoods
The city's adopted 2025–2029 housing and community-development plan identifies a different pattern in parts of the older urban core:
- The West End remains among New Braunfels' relatively affordable, established residential areas.
- Homes within the Loop 337/I-35 core tend to be older and include some of the city's lowest median-income areas.
- Additional lower-income pockets are identified near East Torrey Street and portions of the west side north of I-35.
The higher-income profile of the northwestern ZIP-code area should not be applied to every neighborhood on the city's west side.
4. Housing affordability and household expenses
The 2020–2024 ACS reports the following citywide median housing figures:
| Housing measure | Median amount |
|---|---|
| Owner-occupied home value | $339,400 |
| Monthly ownership costs, with a mortgage | $2,088 |
| Monthly ownership costs, without a mortgage | $745 |
| Monthly gross rent | $1,654 |
Housing cost burden
According to 2019–2023 ACS figures reported in New Braunfels' adopted 2025–2029 Consolidated Plan:
- 46.5% of renter households spend more than 30% of their income on housing.
- 21.8% of homeowner households spend more than 30% of their income on housing.
The 30%-of-income threshold is a commonly used measure of housing cost burden. Despite relatively high citywide household income, housing consumes a substantial share of the budgets of many residents, especially renters.
5. Major drivers of the local economy
New Braunfels' economy is supported by several overlapping industries.
| Economic sector | Local role |
|---|---|
| Tourism and hospitality | Visitor spending, hotels, restaurants, and recreation |
| Retail and distribution | Shopping corridors, warehouses, and logistics |
| Healthcare | Hospitals, medical practices, and support services |
| Government and education | Schools, municipal employment, and county employment |
| Construction | Residential and commercial development |
| Manufacturing | Industrial production and skilled technical employment |
The city's FY2025 financial report estimates approximately $1.3 billion in tourism-related economic impact in 2024 and reports more than 6 million annual visitors. It also cites approximately 58,900 jobs across the local economic area and approximately $8.66 billion in gross regional product.
These figures describe local or regional economic activity rather than household income. The city combines relatively affluent residential areas with industries that employ people across a wide range of wage levels.
6. Population composition
Age distribution
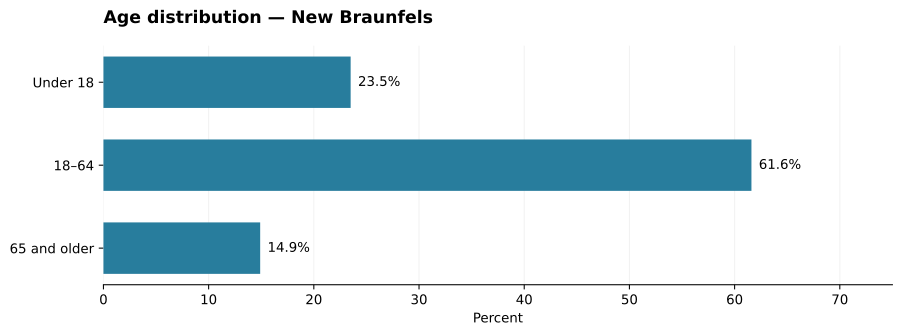
| Age group | Share of population |
|---|---|
| Under 18 | 23.5% |
| Ages 18–64 | 61.6% |
| Ages 65 and older | 14.9% |
Families, working-age residents, and older households all represent substantial portions of the population. New Braunfels is neither predominantly retirement-oriented nor dominated by young adults.
Additional Census QuickFacts indicators include:
| Indicator | Value |
|---|---|
| Adults age 25+ with a bachelor's degree or higher | 38.6% |
| Mean commute time | 27.1 minutes |
| Poverty rate | 7.4% |
7. Race and ethnicity
New Braunfels has a majority White population in the Census Bureau’s race classification, alongside a substantial Hispanic or Latino population. Race and Hispanic origin are measured separately: residents of Hispanic or Latino origin may identify with any race. Consequently, the two sets of percentages should not be added together.
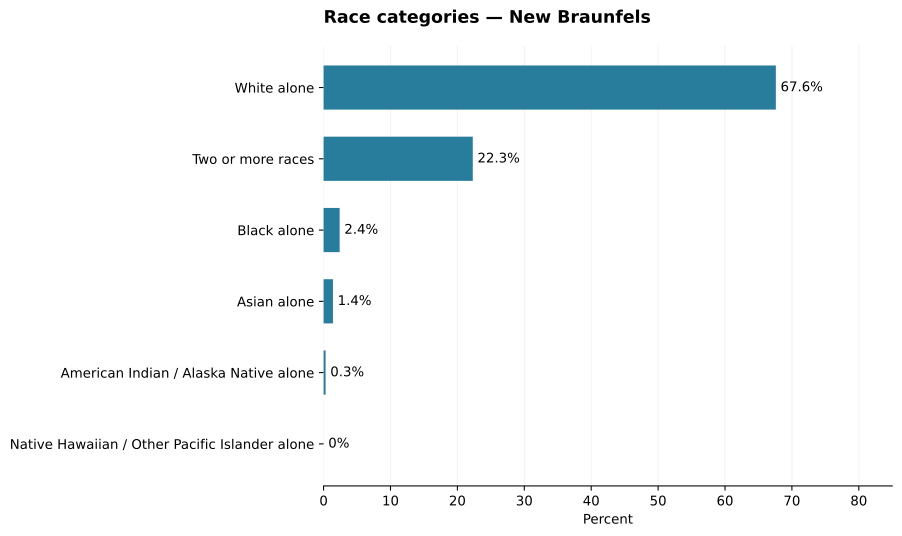
| Census race category | Share of city population |
|---|---|
| White alone | 67.6% |
| Black or African American alone | 2.4% |
| American Indian and Alaska Native alone | 0.3% |
| Asian alone | 1.4% |
| Native Hawaiian and Other Pacific Islander alone | 0.0% |
| Two or more races | 22.3% |
The chart lists the race categories displayed in Census QuickFacts; it does not separately plot its unlisted 'some other race' category. Percentages are rounded. The categories above therefore do not sum to 100%.
Hispanic or Latino residents account for 33.6% of the population, while 59.9% are White alone and not Hispanic or Latino. These are distinct Census measures; they do not form a separate partition with the race categories in the table. [1]
8. Language, birthplace, and households
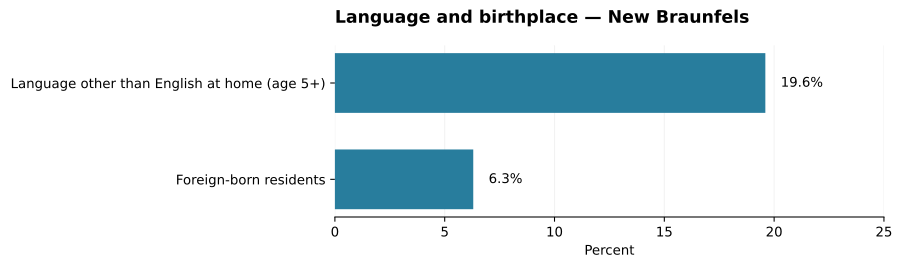
| Indicator | Share or amount | Period / population |
|---|---|---|
| Language other than English spoken at home | 19.6% | Residents age 5+, 2020–2024 |
| Foreign-born population | 6.3% | All residents, 2020–2024 |
| Female residents | 51.0% | Census QuickFacts population estimate |
| Average household size | 2.52 persons | 2020–2024 |
| Residents age 1+ living in same home as one year earlier | 83.7% | 2020–2024 |
Speaking another language at home does not necessarily mean a resident lacks English proficiency, and foreign-born status is not interchangeable with Hispanic or Latino origin. These indicators describe different dimensions of the community. [1]
9. Education, employment, and digital access
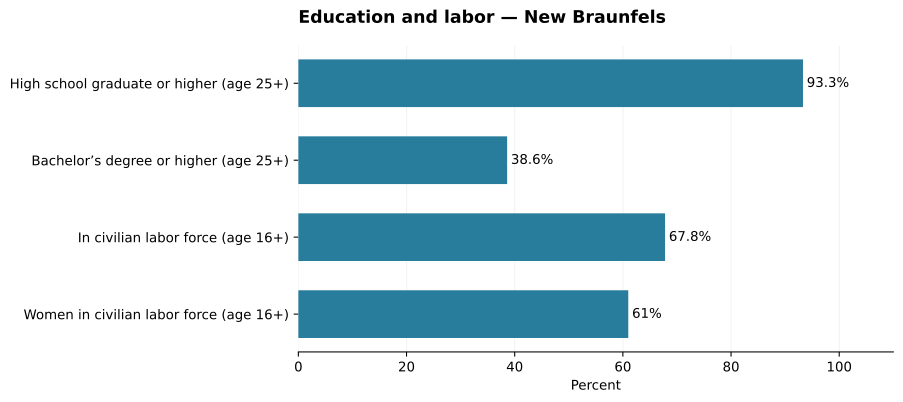
| Indicator | Value | Reference population |
|---|---|---|
| High school graduate or higher | 93.3% | Age 25+, 2020–2024 |
| Bachelor's degree or higher | 38.6% | Age 25+, 2020–2024 |
| Civilian labor-force participation | 67.8% | Age 16+, 2020–2024 |
| Female civilian labor-force participation | 61.0% | Women age 16+, 2020–2024 |
| Households with a computer | 98.0% | Households, 2020–2024 |
| Households with a broadband internet subscription | 95.0% | Households, 2020–2024 |
| Residents under age 65 without health insurance | 12.4% | Under age 65, Census QuickFacts |
Educational attainment, participation in the civilian labor force, and access to computers and broadband describe different features of residents' everyday economic circumstances. They should not be interpreted as equivalent measures of employment or disposable income. [1]
10. Religion in the surrounding county
Religion is not measured by the U.S. decennial Census or the ACS. The 2020 U.S. Religion Census supplies county-level counts reported by participating religious bodies. Its coverage is Comal County, which includes New Braunfels and other communities; the figures below are not New Braunfels city estimates. [6, 7]
The study reported 115 congregations and 97,663 adherents across participating religious bodies in Comal County in 2020, equivalent to about 60.5 reported adherents per 100 county residents. This is a measure of counted religious adherence, not a survey showing that 60.5% personally identify as religious. [6, 8]
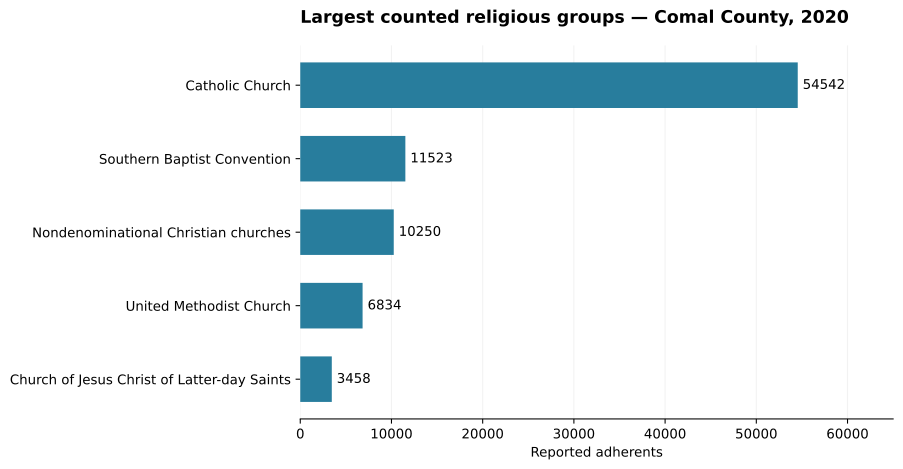
| Religious body | Reported adherents | Congregations |
|---|---|---|
| Catholic Church | 54,542 | 5 |
| Southern Baptist Convention | 11,523 | 22 |
| Nondenominational Christian churches | 10,250 | 17 |
| United Methodist Church | 6,834 | 6 |
| Church of Jesus Christ of Latter-day Saints | 3,458 | 7 |
These are the five largest reported bodies in the county-level tabulation, not a complete list of faiths. Adherent definitions vary among religious organizations and can include children and regular participants as well as formal members. Some religious groups are uncounted or have incomplete membership reporting. The difference between the total county population and counted adherents must not be labeled 'nonreligious' or 'unaffiliated'. [7, 8]
11. Overall economic and demographic picture
Fast growth and mixed household circumstances. The population more than doubled between 2010 and the 2025 estimate, and 43.5% of households earn $100,000 or more, while 24.7% earn less than $50,000.
Sharp geographic differences. The western and northwestern ZIP-code area has substantially higher reported household incomes and home values than the broader central, eastern, and southern ZIP-code area. Older neighborhoods within city limits contain lower-income pockets, so ZIP-code averages conceal important variation.
Housing cost pressures. Nearly half of renters and more than one-fifth of homeowners exceeded the 30% housing-cost-burden threshold in the city's cited housing-plan data.
A changing, varied population. Census data show substantial representation across age groups, 33.6% Hispanic or Latino origin, a measurable multilingual population, and high rates of household computer and broadband access. Religion counts provide complementary context at the county level but cannot define the beliefs of New Braunfels residents individually.
Sources and data notes
- U.S. Census Bureau — QuickFacts, New Braunfels city, Texas. 2010 and 2020 Census totals; 2025 population estimate; 2020–2024 ACS household, race, ethnicity, language, birthplace, education, housing, labor-force, and connectivity indicators. https://www.census.gov/quickfacts/fact/table/newbraunfelscitytexas/POP010220
- U.S. Census Bureau — American Community Survey, 2020–2024 five-year estimates. City and ZIP Code Tabulation Area income distribution, housing, and demographic indicators. https://data.census.gov/ (Underlying ACS data; ZIP boundaries do not necessarily coincide with postal ZIP codes or city limits.)
- ZIP-Codes.com — ZIP 78130 and ZIP 78132 area profiles. Source used in the existing article for ZIP-level income, property value, tenure and median-age comparisons; ages use 2020 Census profiles, while income and housing reflect ACS 2020–2024. https://www.zip-codes.com/
- City of New Braunfels — Adopted 2025–2029 CDBG Consolidated Plan. Housing burden and geographic neighborhood patterns, including block-group income maps. https://www.newbraunfels.gov/DocumentCenter/View/20180/City-of-New-Braunfels-Adopted-2025-2029-CDBG-Consolidated-Plan
- City of New Braunfels — FY2025 Annual Comprehensive Financial Report. Tourism impact, annual visits, employment and gross regional product. https://www.newbraunfels.gov/DocumentCenter/View/45397/FY-2025-Annual-Comprehensive-Financial-Report
- 2020 U.S. Religion Census — county summary tables and report. Comal County congregations and reported adherents. https://www.usreligioncensus.org/sites/default/files/2023-10/2020_US_Religion_Census.pdf
- Association of Statisticians of American Religious Bodies / Association of Religion Data Archives — 2020 Religious Congregations and Membership Study. Coverage, definitions and methodological limitations. https://www.thearda.com/data-archive?fid=RCMSCY20
- Churches List — Comal County denominational data presentation. Group-specific Comal County 2020 figures sourced from the U.S. Religion Census; a secondary presentation rather than an independent survey. https://churcheslist.com/county/tx/comal-county
- GeoStat and Neilsberg — ACS-based household income summaries used in the original income-distribution article. Figures should be checked against ACS table B19001 before any future revisions. https://www.geostat.org/ and https://www.neilsberg.com/
Data periods differ by measure. Race and population indicators reflect the Census Bureau QuickFacts release available in October 2026; most household measures use 2020–2024 ACS estimates. Religious membership counts are from 2020 and cover Comal County rather than the city. Graphics are original visualizations of the cited published counts and percentages, not new surveys.